We've all seen them; they're everywhere these days. A little bit of text plus a few seductive images sucking you in without even offering you dinner first. What is it about infographics that make them so effective in explaining a topic, selling an idea, or dissecting a problem?
By definition, infographics are visual images such as a chart or diagram used to represent information or data. Simple enough, right? Maybe. Or maybe not.
If you've ever played Pictionary then you know the struggle of designing an infographic. Something that appears so uncomplicated becomes beyond frustrating when the intended viewer cannot figure out the difference between for example, a chocolate chip cookie and the pepperoni pizza you just meticulously drew.
According to Matt Haworth, director and co-founder of Reason Digital, "A great infographic can convey a story, new or previously undiscovered information or can present a new angle or fresh perspective on accepted wisdom. It should be compelling, in terms of the information and the visual design. You should be able to understand the key message from looking at it for 5 seconds, but it should also be teaching you things if you look at it for a minute or two."
Whew! That's a lot to ask of an image. But it can be done! For example, Blue Setter Creative designed an infographic for Connect Massage letting potential clients know how the clinic was designed with larger bodies in mind:
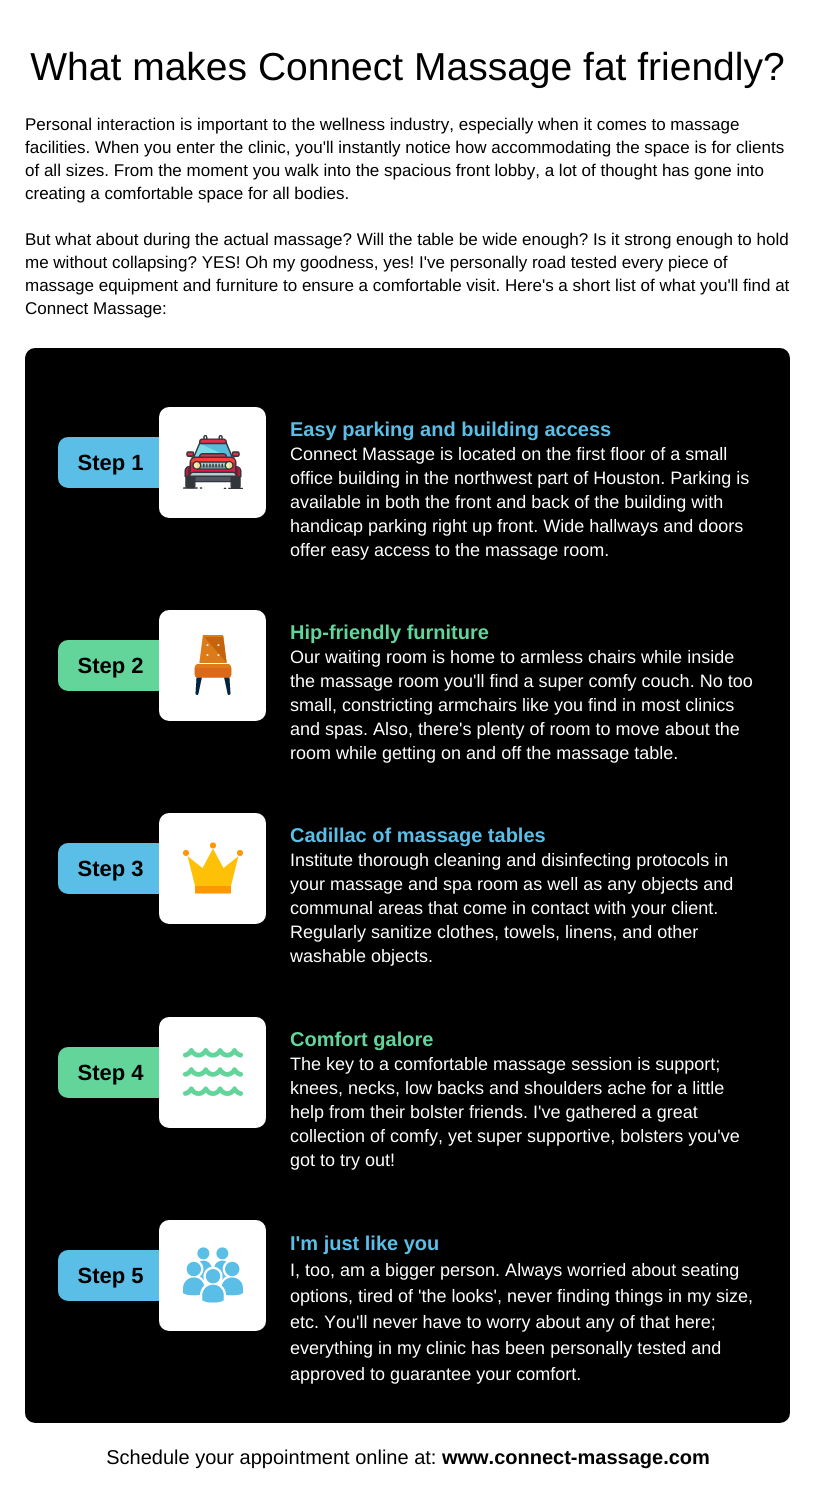
Easy to read, chock full of relevant info and visually appealing, this graphic not only let's Connect Massage clients know the 411 on what to expect , it also conveys the easy-going atmosphere of the clinic.
Interested in creating infographics to help promote YOUR business? We'd love to help out! Connect with Blue Setter Creative here.